Introduction
Public opinion polling is essential to understanding democratic discourse: polls measure the will of voters and help to promote election integrity. In this blog, I use both national and state-level polling data to predict election outcomes for the 2024 presidential election.
Historical Polling Averages (2016-2024)
First, I examine overall trends in election-year polling averages. The following visualization contains three plots: the percentage of average poll approval for both the Republican and Democratic candidates are plotted by date for 2016 (March-November), 2020 (March-November), and 2024 (March-September).
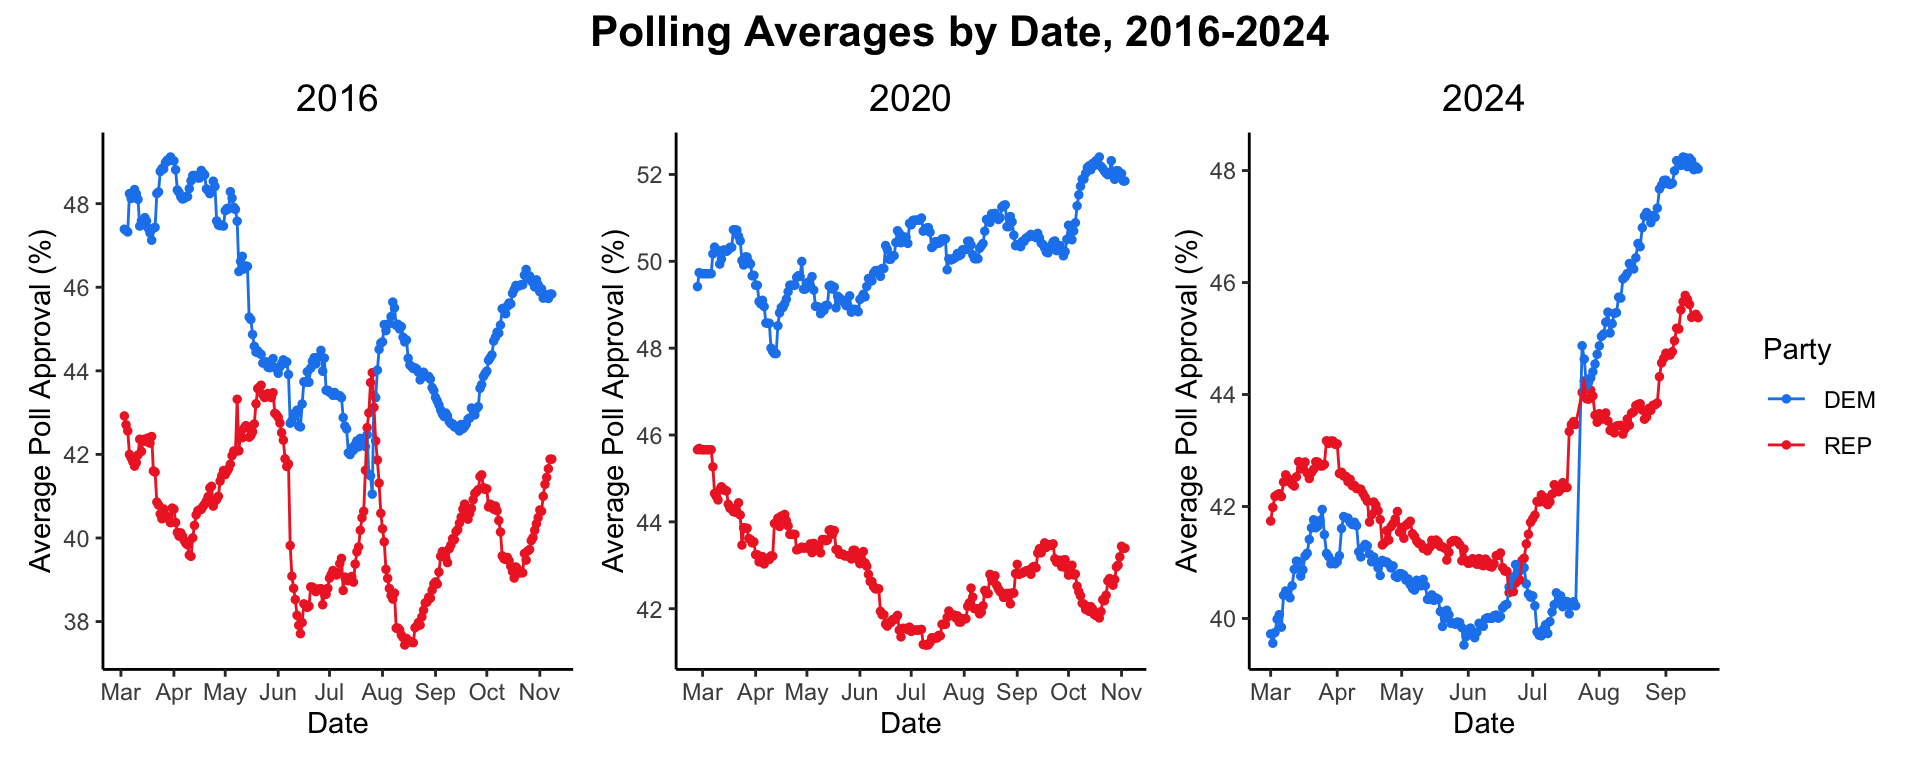
In both 2016 and 2020, the Democratic candidate began the year polling higher than the Republican candidate. While the polling gap in 2016 tightened by mid-year, President Biden consistently maintained a polling advantage over former President Trump in 2020.
So far, trends in the polling data for 2024 are fascinating: heading into the summer, Trump narrowly led Biden in a contested race with about two percentage points separating the candidates. The script has clearly flipped since Vice President Harris entered the race: average poll approval for the Democratic candidate has largely surged past that of the Republican candidate. For both parties, average poll approval appears to have overall increased over time.
Polling Averages for 2024
To dive deeper into 2024, I create a plot of the polling averages by date with some potential “game-changers,” which are events (e.g. party conventions) that could have an effect on voter behavior. The following plot only includes polling data from May to mid-September, since I want to focus on the presidential contest between Harris and Trump.
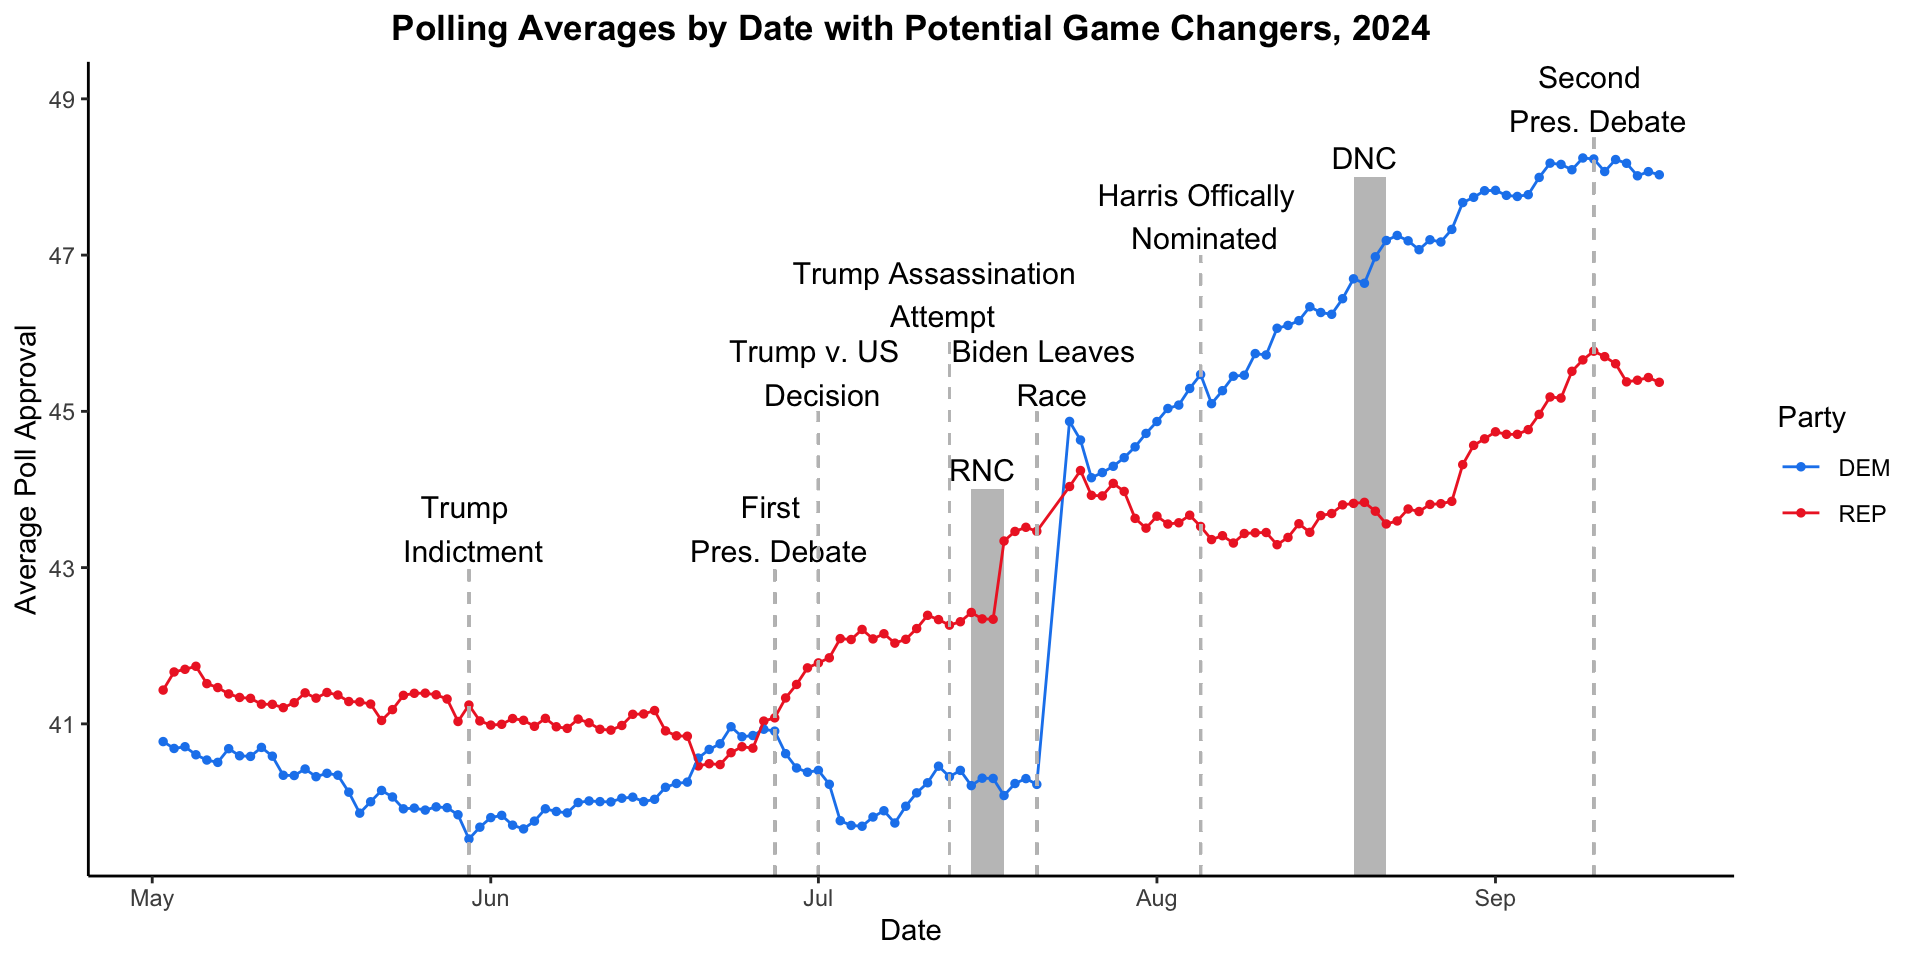
Overall, it seems like polling changed little in the aftermath of these so-called “game-changers” with two notable exceptions: average poll approval diverged after the first presidential debate in favor of the Republican candidate, and there was a massive spike in average poll approval for the Democratic candidate after Biden ended his re-election bid. However, it is difficult to establish a direct causal relationship between the occurrence of such events and trends in public opinion.
Predicting 2024 National Two-Party Vote Share with Sept. Polling Averages
To incorporate polling data in a predictive model for the 2024 election, I use an ordinary least squares (OLS) regression model to analyze the relationship between national polling data from September of an election year and national two-party popular vote share, specifically for the Democratic candidate. In the model, I weighted the September polling data by the number of weeks remaining before the election. This adjustment accounts for the idea that polls taken closer to Election Day tend to be more predictive of voter behavior.
This is a regression table for the Democratic candidate’s national popular vote share and national polling in September for the presidential elections from 1948-2020.
| Democratic Candidate's National Popular Vote Share | ||||
|---|---|---|---|---|
| Predictors | Estimates | std. Error | CI | p |
| (Intercept) | 23.14 | 0.88 | 21.40 – 24.87 | <0.001 |
| sept poll | 0.60 | 0.02 | 0.56 – 0.64 | <0.001 |
| Observations | 420 | |||
| R2 / R2 adjusted | 0.678 / 0.677 | |||
From this table, we see that national polling in September is a relatively strong predictor of the Democratic candidate’s share of the two-party popular vote. The R-squared values of approximately 0.68 suggest that the model is a good fit to the data. Similar to last week, it is important to note that utilizing in-sample model fit alone can contribute to overconfidence or over-fitting.
Then, I utilize this model to predict the national two-party vote share for Harris in 2024. I take the weighted average of the national polling data from September: values from polls conducted closer to the election (fewer weeks left) have a higher impact on the overall average than polls taken earlier in the month.
| Prediction | Lower Bound | Upper Bound |
|---|---|---|
| 51.99 | 37.62 | 66.36 |
This model predicts that Harris will receive about 52% of the national two-party popular vote in November. However, the wide range between the lower and upper bounds (37.62% to 66.36%) suggests that there’s a significant amount of uncertainty in this prediction, which may be due to the variance in the underlying polling data. Another caveat of this prediction is that it does not include polling data for the entire month of September: there is only polling data available up to the date of this blog’s writing (September 16, 2024).
Predicting 2024 State Two-Party Vote Share with Sept. Polling Averages
I follow a similar series of steps to put together state-level predictions for the Democratic candidate’s two-party vote share. First, I create an ordinary least squares (OLS) regression model for the relationship between state polling data from September of an election year and two-party popular vote share on the state level, and weight the model by weeks left before the election. I also narrow the year range to 2000-2020 to better reflect modern voter demographics, polling methodologies, and partisan alignments.
This is a regression table for the Democratic candidate’s state-level popular vote share and state-level polling in September for the presidential elections from 2000-2020.
| Democrat's State-Level Popular Vote Share | ||||
|---|---|---|---|---|
| Predictors | Estimates | std. Error | CI | p |
| (Intercept) | 1.52 | 0.26 | 1.02 – 2.02 | <0.001 |
| sept poll | 1.09 | 0.01 | 1.08 – 1.10 | <0.001 |
| Observations | 8380 | |||
| R2 / R2 adjusted | 0.807 / 0.807 | |||
With an R-squared value of 0.81, this table suggests that state-level September polling is a strong predictor for the Democratic candidate’s two-party popular vote share for that state.
I then use this regression model to predict Harris’ share of the two-party popular vote on the state-level. Again, this prediction only includes polling data up to mid-September. Furthermore, the data set from FiveThirtyEight only includes polls from 15 states for the 2024 election cycle; it is of note, though, that the seven key battleground states for this year’s election are included. The following table presents the predicted two-party vote share for Harris in 15 states.
| State | Prediction | Lower Bound | Upper Bound | Winner |
|---|---|---|---|---|
| Arizona | 52.52 | 30.33 | 74.72 | Harris |
| California | 66.37 | 44.17 | 88.56 | Harris |
| Florida | 50.61 | 28.42 | 72.81 | Harris |
| Georgia | 53.17 | 30.97 | 75.37 | Harris |
| Michigan | 53.41 | 31.21 | 75.60 | Harris |
| Minnesota | 55.88 | 33.68 | 78.07 | Harris |
| Nevada | 52.77 | 30.57 | 74.96 | Harris |
| New Hampshire | 57.07 | 34.87 | 79.27 | Harris |
| North Carolina | 52.92 | 30.72 | 75.11 | Harris |
| Ohio | 48.20 | 26.01 | 70.40 | Trump |
| Pennsylvania | 53.20 | 31.00 | 75.39 | Harris |
| Texas | 49.80 | 27.61 | 72.00 | Trump |
| Virginia | 55.79 | 33.60 | 77.99 | Harris |
| Wisconsin | 54.56 | 32.36 | 76.75 | Harris |
The “Winner” column notes the winner of the state based on the predicted two-party popular vote share for Harris. This model therefore predicts that Harris will win 13 of the 15 states, including all seven key battleground states. That being said, it is important to note the prediction intervals, which indicate relatively high levels of uncertainty. Furthermore, the predicted two-party popular vote share for Harris for the majority of these states is quite close to 50% (e.g. Florida at 50.61%, Arizona at 52.52%), which suggest very closely contested races. Perhaps polling closer to the election will offer more precise estimates of this year’s presidential election outcomes.
Conclusion
As I continue to build my predictive model for the 2024 presidential election, I think that it is important to incorporate the average of the most recent polls as a predictor. In the following weeks, I hope to begin creating a predictive model that includes both economic fundamentals (explored in last week’s blog) and public opinion polling.