Introduction
“It’s the economy, stupid.” Coined by political strategist Jim Carville, the phrase became a hallmark of Bill Clinton’s successful election bid against incumbent George H.W. Bush in 1992. Larry Bartels and Christopher Achen note in their 2016 book Democracy for Realists that voters engage in “economic voting,” through which economic distress — especially during an election year — harms election outcomes for the incumbent. However, to what extent do Americans truly vote based on the state of the economy? In this blog, I utilize economic factors such as GDP and RDI growth to predict presidential election outcomes and assess the utility of a predictive model based solely on the economy.
Historical Trends with Gross Domestic Product (GDP)
To start, I analyze the relationship between GDP growth and the incumbent party’s national popular vote share from past presidential elections. I utilize GDP growth from Quarter 2 (Q2) of an election year: Q2 is the period of April through June, which provides a stable but recent snapshot of the pre-election economy.
Notably, the plot on the left includes all the presidential elections from 1948-2020, while the plot on the right excludes 2020. The 2020 contest between President Joe Biden and former President Donald Trump is a significant outlier: unprecedented economic turmoil stemming largely from the COVID-19 pandemic tanked the national economy during that election year.
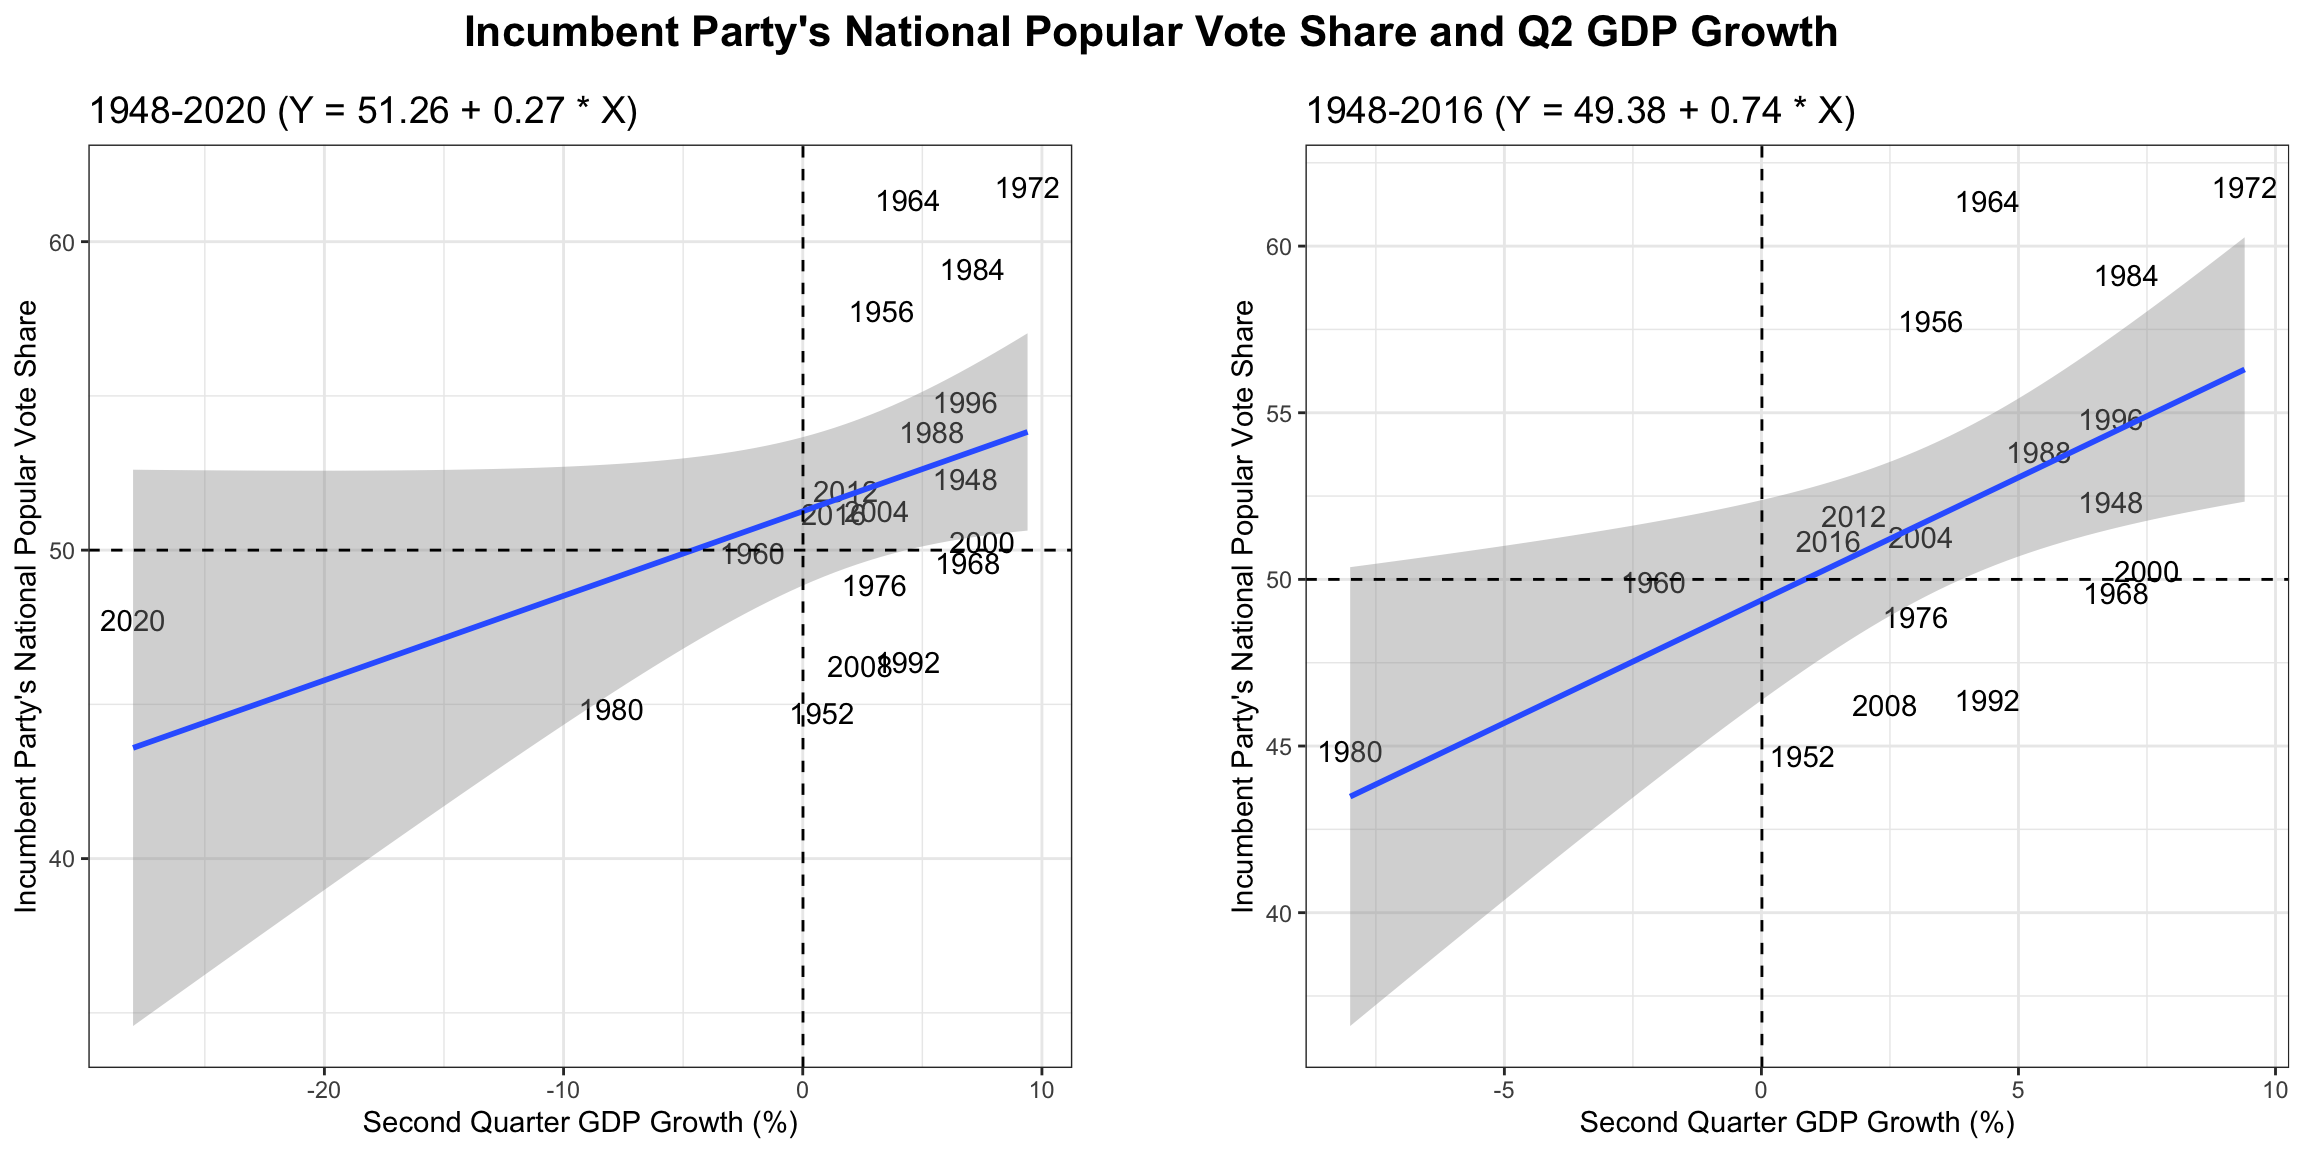
This is a regression table for the incumbent party’s national popular vote share and Q2 GDP growth for the presidential elections from 1948-2016.
| Incumbent Party's National Popular Vote Share | ||||
|---|---|---|---|---|
| Predictors | Estimates | std. Error | CI | p |
| (Intercept) | 49.38 | 1.42 | 46.37 – 52.38 | <0.001 |
| GDP growth quarterly | 0.74 | 0.27 | 0.17 – 1.30 | 0.014 |
| Observations | 18 | |||
| R2 / R2 adjusted | 0.325 / 0.283 | |||
As expected, there is a positive relationship between Q2 GDP growth and the incumbent party’s national popular vote in past presidential elections. This correlation strengthens when we exclude the 2020 election: the slope of the line of best fit increases from 0.27 to 0.74. However, the R-squared value of approximately 0.2 for the 1948-2016 plot suggest that this relationship isn’t particularly strong. R-squared values measure how much variation in the dependent variable (incumbent party’s national vote share in this case) is captured by the fitted model’s predicted value — offering an ease of interpretability for in-sample fit. However, it is important to note that utilizing in-sample model fit alone can contribute to overconfidence or over-fitting.
Historical Trends with Real Disposable Personal Income (RDI)
Similarly, I examine the relationship between Q2 RDI growth and the incumbent party’s national popular vote share. I include RDI in this blog to engage with more individualistic perceptions of voter behavior like “pocketbook voting”: voters may prioritize their own economic well-being over broader national indicators like GDP. The left plot includes presidential elections from 1948-2020, while the right plot excludes 2020.
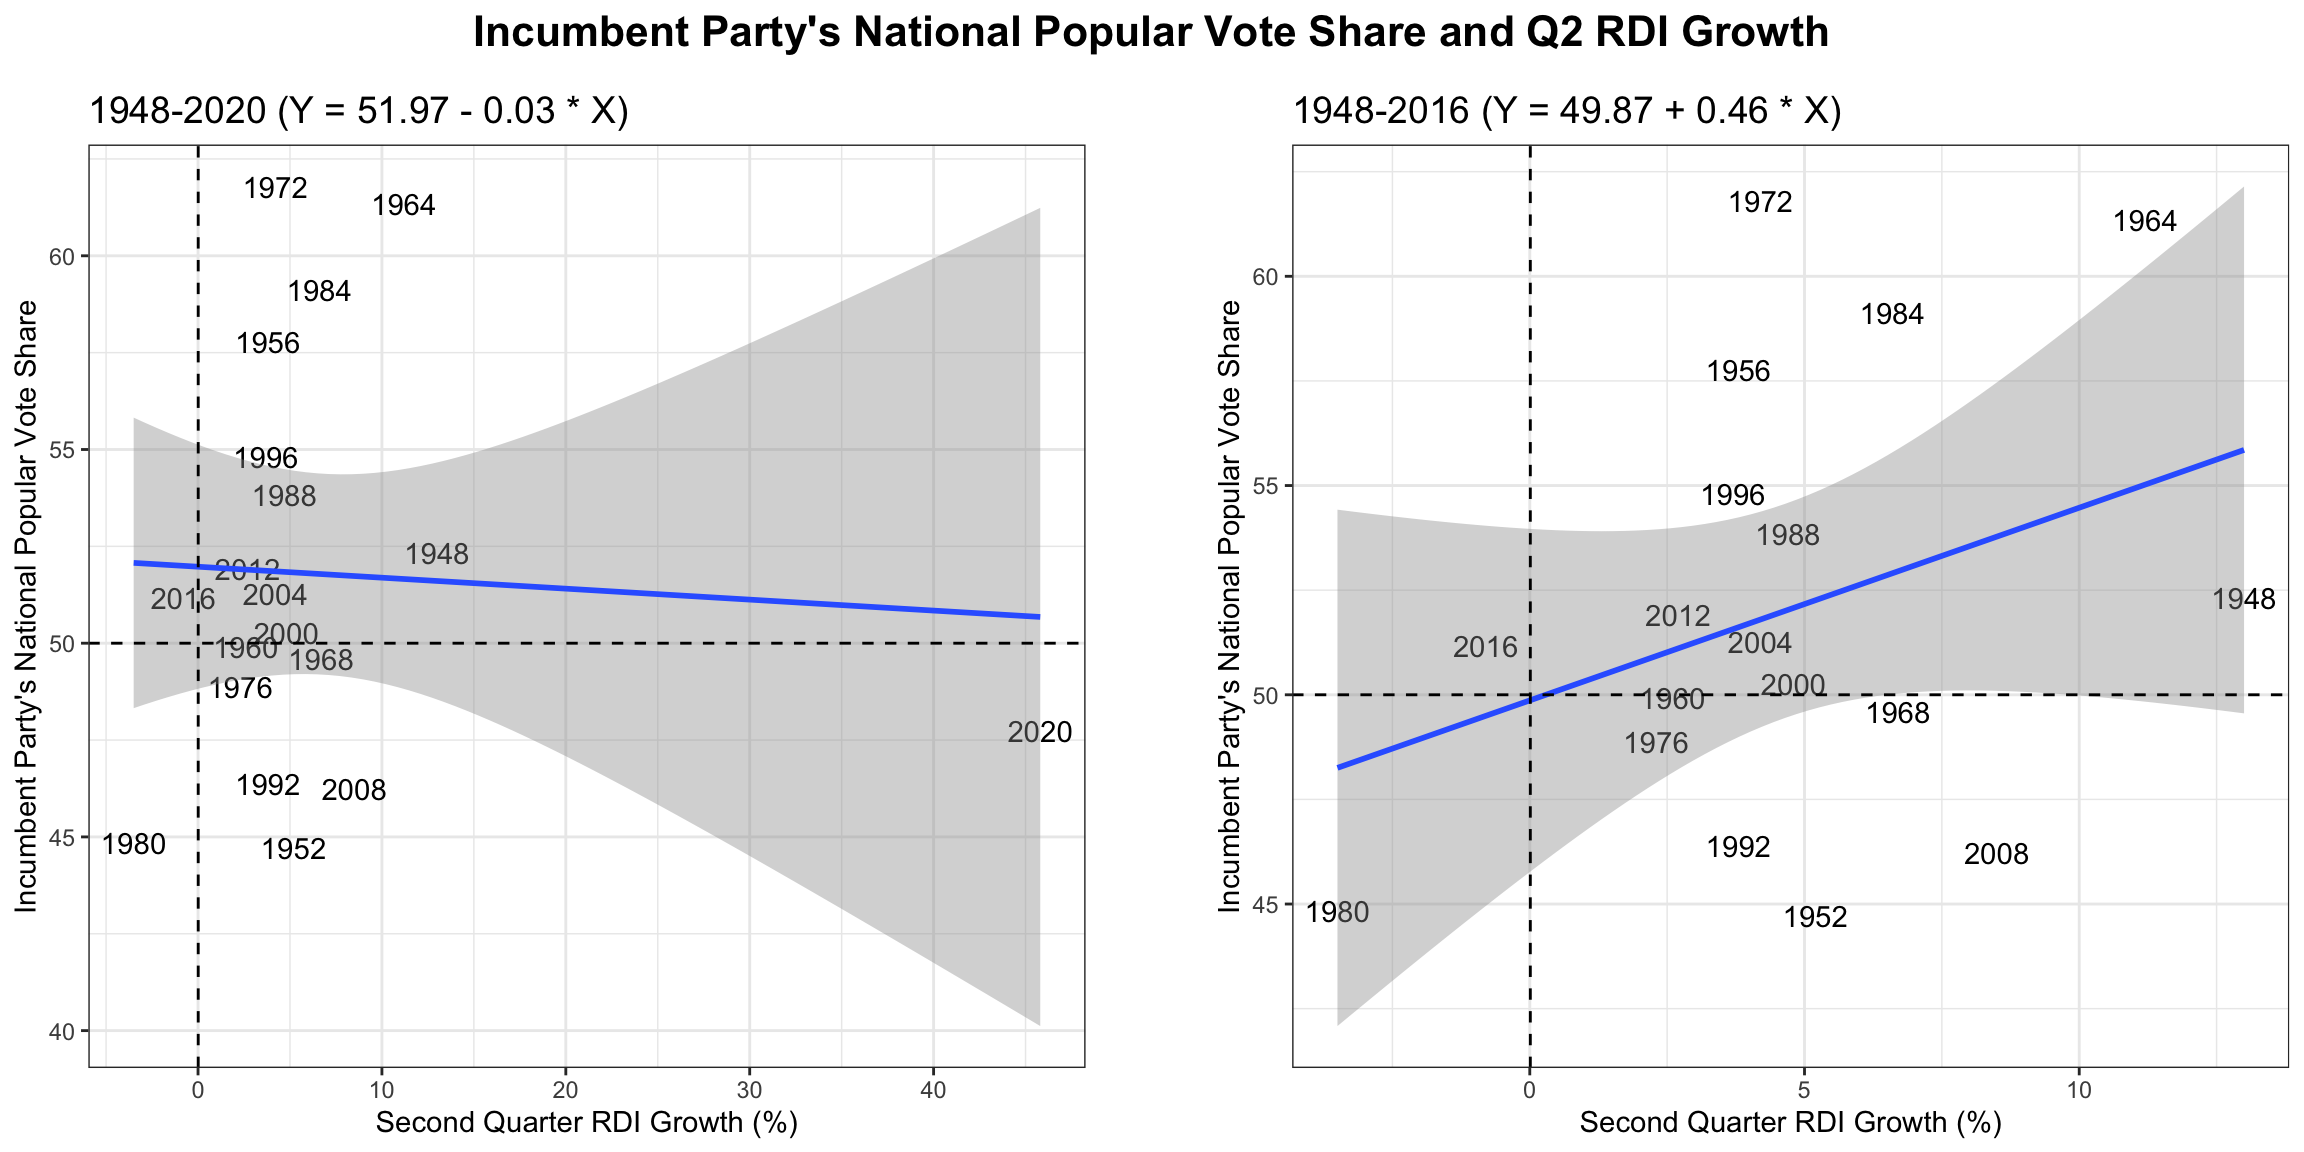
This is a regression table for the relationship between the incumbent party’s national popular vote share and Q2 RDI growth for the presidential elections from 1948-2016.
| Incumbent Party's National Popular Vote Share | ||||
|---|---|---|---|---|
| Predictors | Estimates | std. Error | CI | p |
| (Intercept) | 49.87 | 1.93 | 45.77 – 53.96 | <0.001 |
| RDPI growth quarterly | 0.46 | 0.32 | -0.23 – 1.15 | 0.176 |
| Observations | 18 | |||
| R2 / R2 adjusted | 0.111 / 0.056 | |||
With RDI, excluding 2020 makes quite a significant difference: the slope of the best fit line jumps from -0.03 to 0.46. Again, there appears to be a positive correlation between Q2 RDI growth and the incumbent party’s national popular vote share in past presidential elections. The R-squared values here are lower than those for GDP growth, however, which suggests that the Q2 RDI growth is also not a strong predictor of the incumbent party’s national popular vote share.
Sitting Presidents vs Same-Party Heirs
Next, I examine whether the effect of the economy is stronger for sitting presidents running for re-election compared to same-party heirs seeking the office. First, I sorted the data into elections where the incumbent was running for re-election (11 elections) and elections where a candidate of the incumbent’s party was running (7 elections). The left plot is for sitting presidents, while the right plot is for same-party heirs. Once again, I exclude 2020 from the analysis.
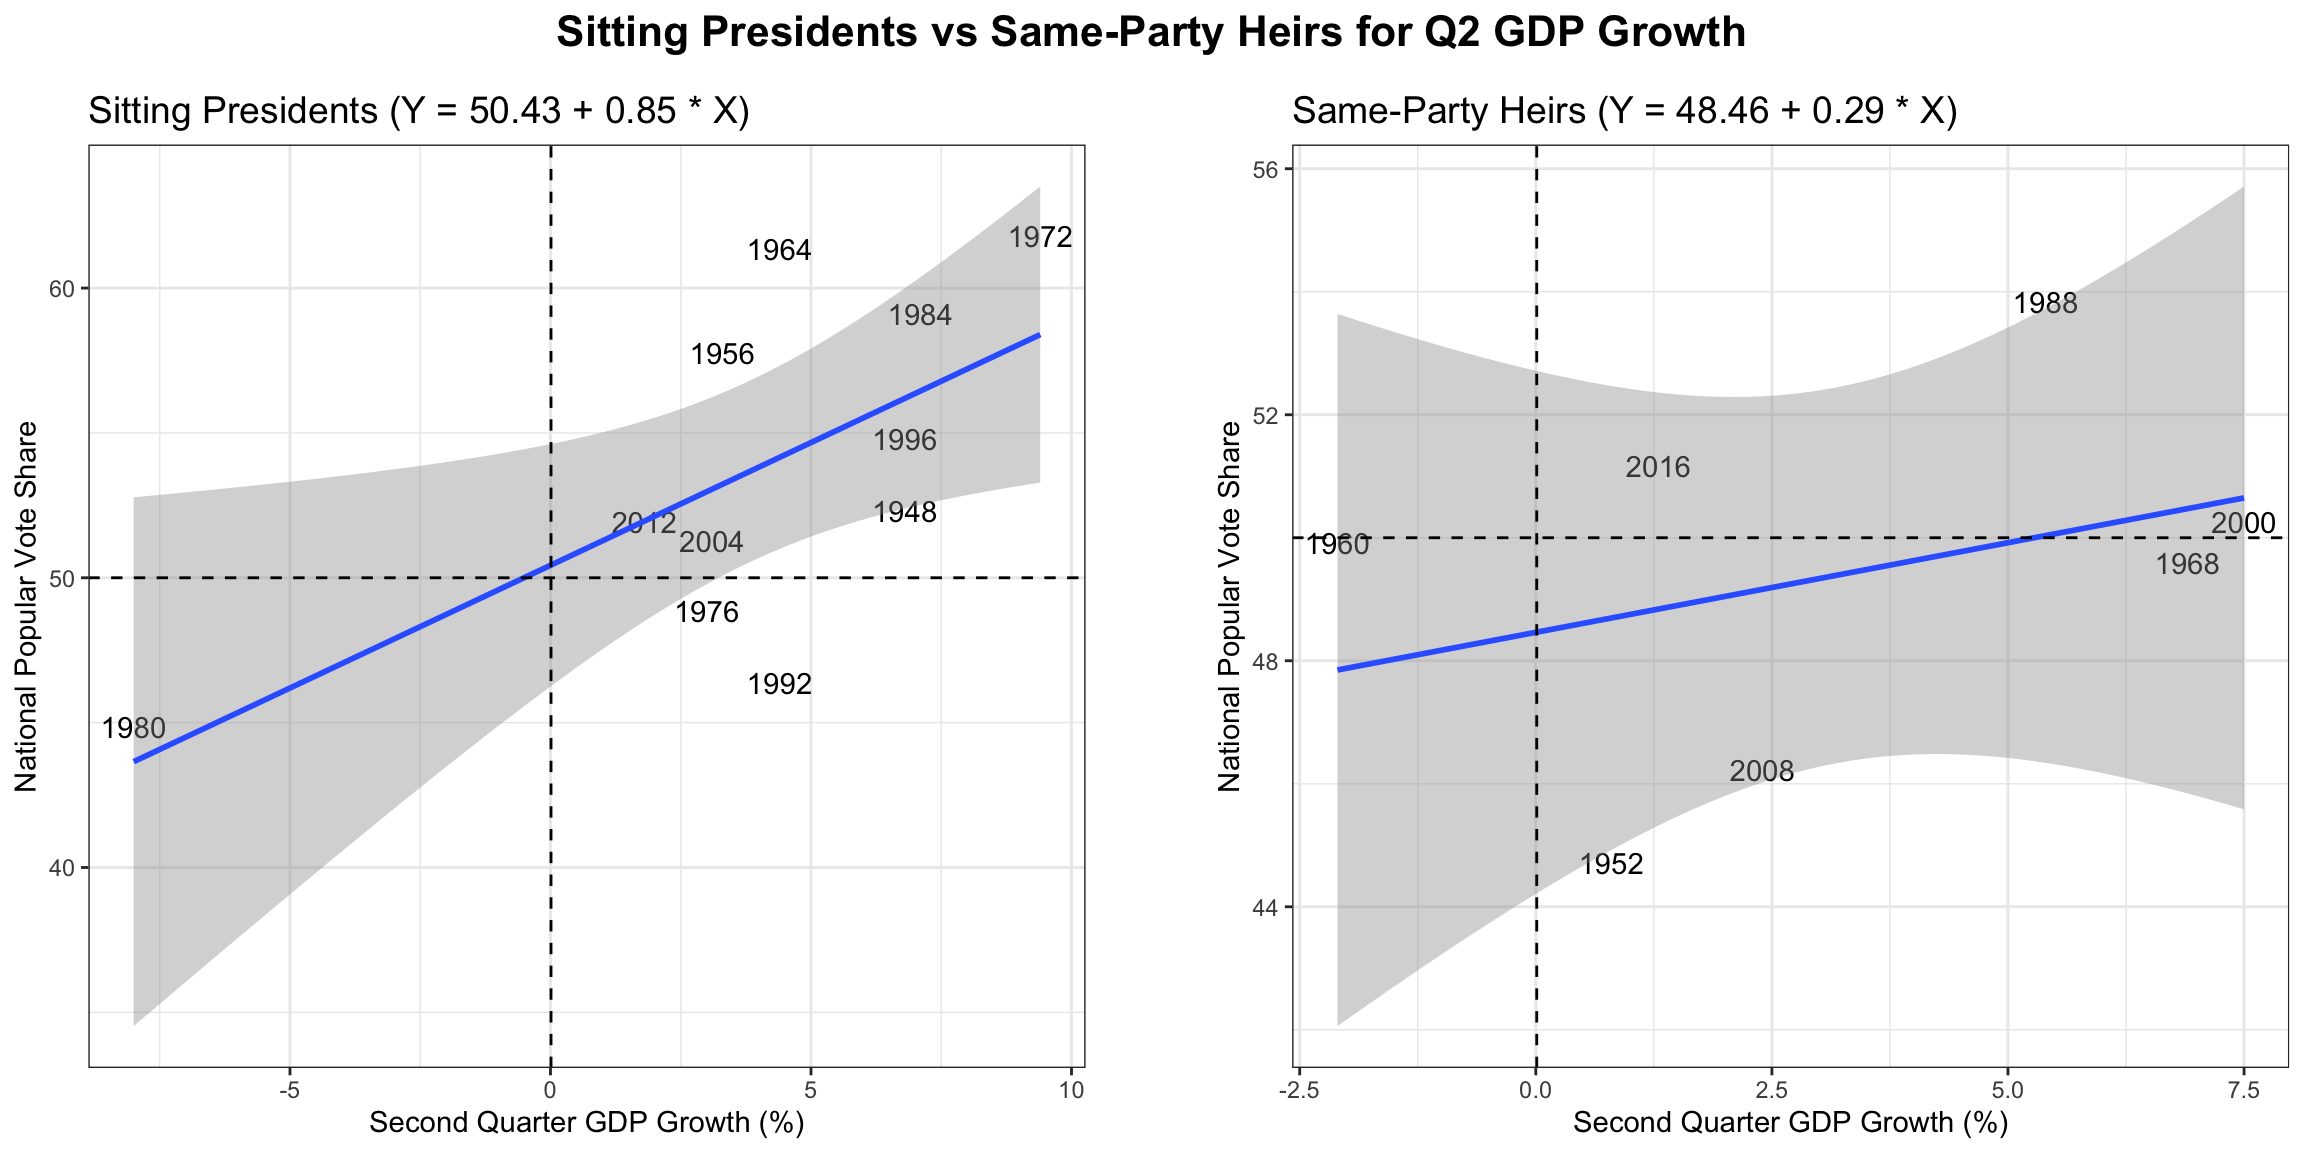
The associated regression table is below.
| Sitting Presidents | Same-Party Heirs | |||||||
|---|---|---|---|---|---|---|---|---|
| Predictors | Estimates | std. Error | CI | p | Estimates | std. Error | CI | p |
| (Intercept) | 50.43 | 1.85 | 46.25 – 54.61 | <0.001 | 48.46 | 1.65 | 44.21 – 52.72 | <0.001 |
| GDP growth quarterly | 0.85 | 0.32 | 0.12 – 1.57 | 0.027 | 0.29 | 0.36 | -0.64 – 1.22 | 0.458 |
| Observations | 11 | 7 | ||||||
| R2 / R2 adjusted | 0.437 / 0.375 | 0.114 / -0.063 | ||||||
With a slope of 0.85, it seems that there is a stronger correlation between Q2 GDP growth and national popular vote share for sitting presidents running for re-election than same-party heirs (0.29). The R-squared value for the sitting presidents model is also larger (0.44 vs 0.11), which means that Q2 GDP growth is a much stronger predictor of the national popular vote share for sitting presidents than same-party heirs.
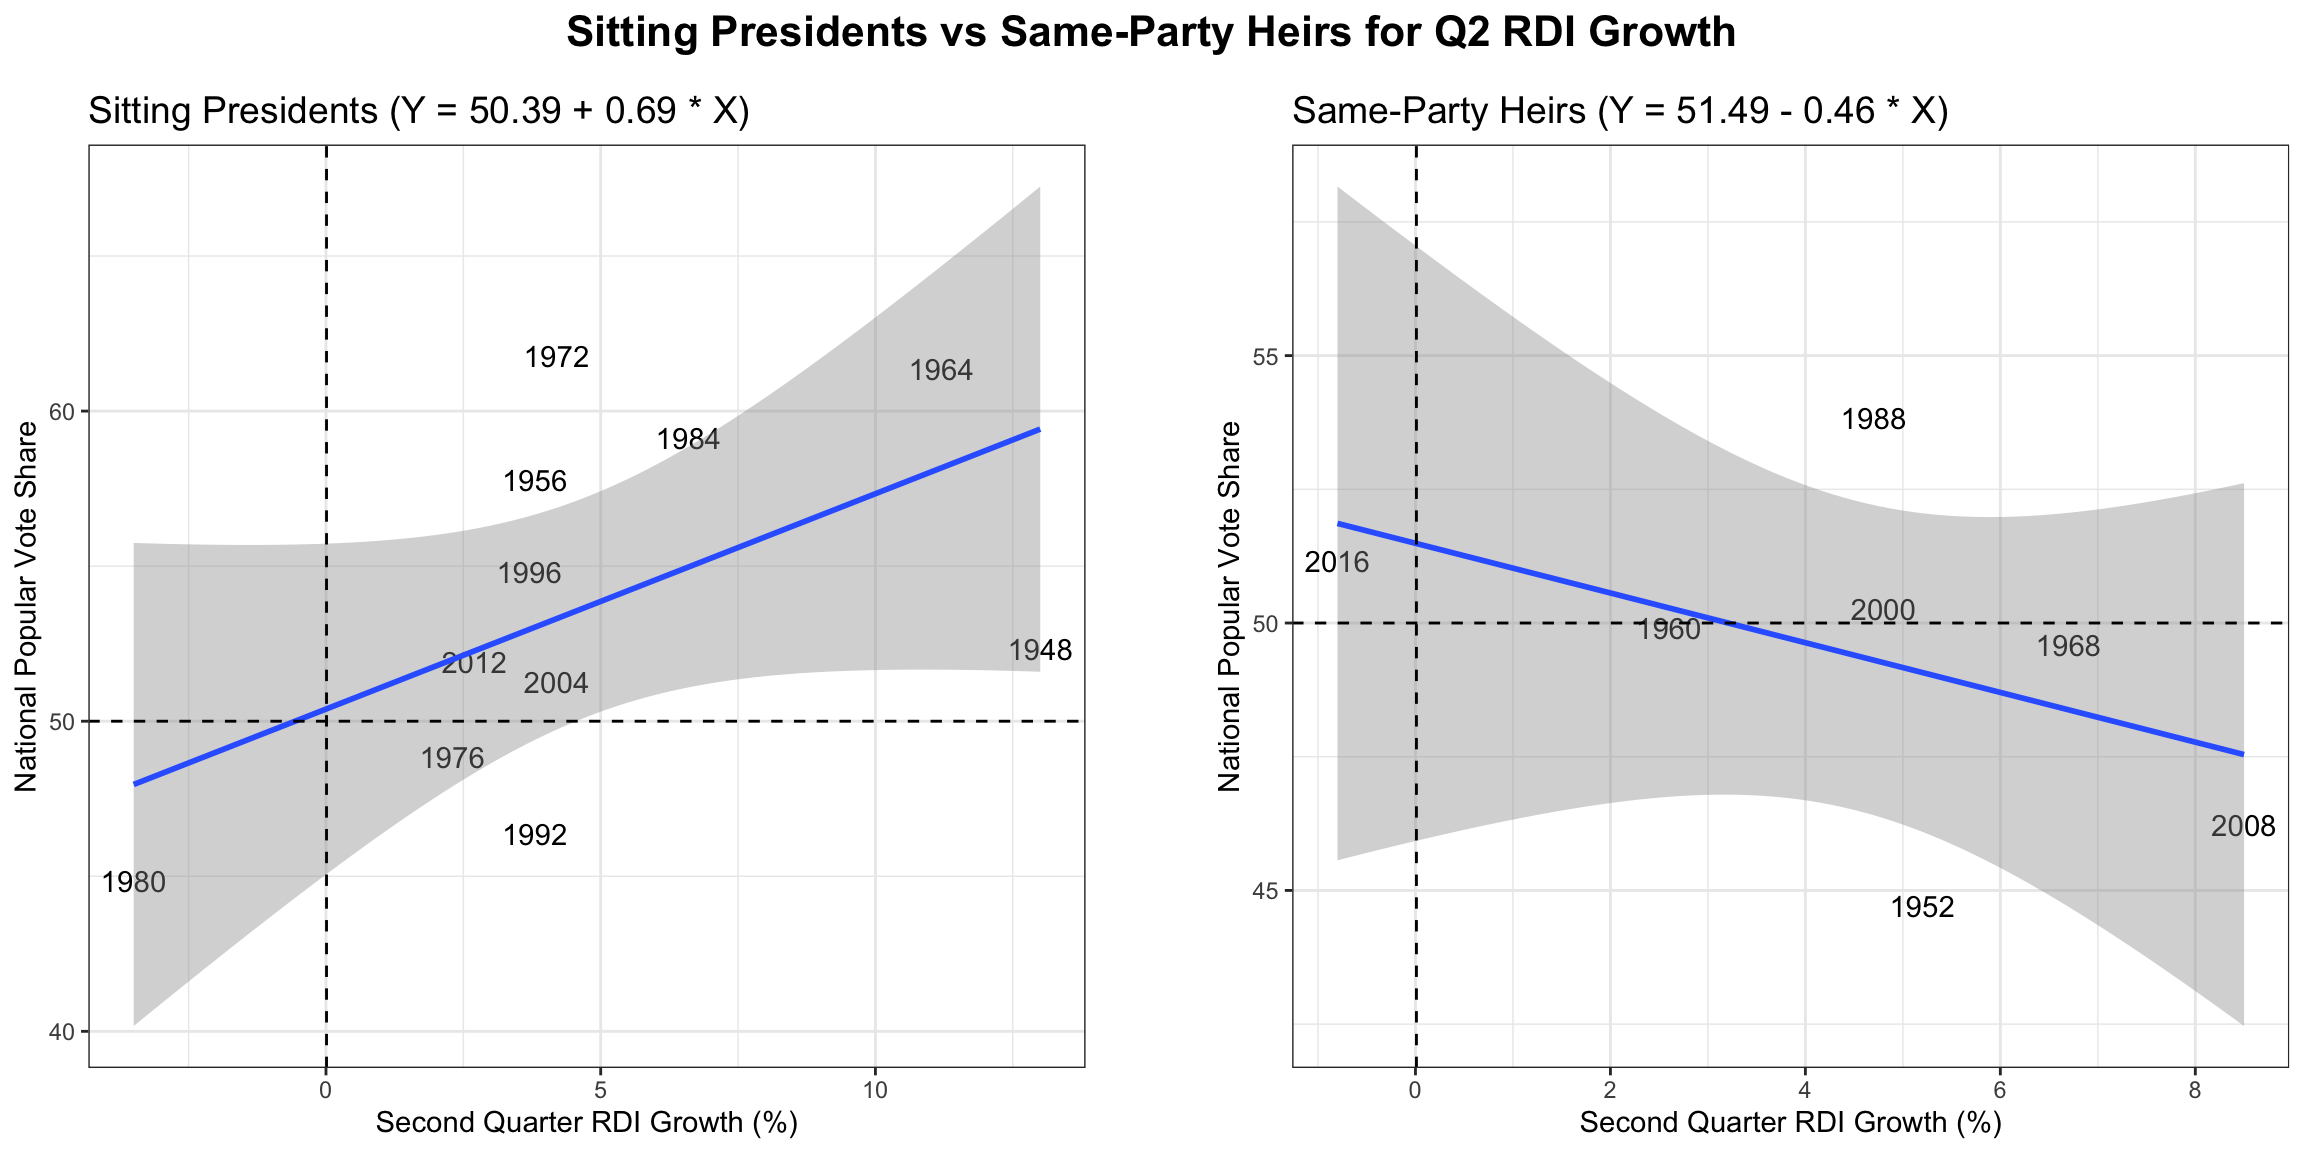
I created the same visualizations for Q2 RDI growth.
| Sitting Presidents | Same-Party Heirs | |||||||
|---|---|---|---|---|---|---|---|---|
| Predictors | Estimates | std. Error | CI | p | Estimates | std. Error | CI | p |
| (Intercept) | 50.39 | 2.36 | 45.06 – 55.73 | <0.001 | 51.49 | 2.17 | 45.92 – 57.06 | <0.001 |
| RDPI growth quarterly | 0.69 | 0.37 | -0.15 – 1.54 | 0.095 | -0.46 | 0.41 | -1.51 – 0.59 | 0.307 |
| Observations | 11 | 7 | ||||||
| R2 / R2 adjusted | 0.279 / 0.198 | 0.206 / 0.047 | ||||||
For RDI, sitting presidents have historically enjoyed a positive correlation between Q2 RDI growth and national popular vote share with a slope of 0.69 for the line of best fit. On the other hand, there appears to be a negative relationship between Q2 RDI growth and national popular vote share for same-party heirs with a slope of -0.46. Again, the R-squared value for the sitting presidents model is a bit greater (0.28 vs 0.21), which means that Q2 RDI growth is a stronger predictor of the national popular vote share for sitting presidents than same-party heirs.
Predictions for 2024
While such univariate models are imperfect, we can still use them to develop predictions for the 2024 election. The following table utilizes the regression models included in this blog to estimate the national popular vote share for the incumbent party’s candidate; in this case, Vice President Kamala Harris is a same-party heir so those equations also apply. Based on the table, Harris is predicted to receive a bit over 50% of the national popular vote this November.
| Model | Fit | Lower CI | Upper CI |
|---|---|---|---|
| GDP | 51.58 | 41.86 | 61.31 |
| Heir GDP | 49.34 | 40.69 | 57.98 |
| RDI | 50.33 | 38.90 | 61.76 |
| Heir RDI | 51.03 | 42.04 | 60.01 |
Conclusion
In very general terms, it seems that the incumbent’s party enjoys an advantage when the economy is doing well. Furthermore, the effect of the economy appears to be stronger for sitting presidents running for re-election than same-party heirs.
However, the relatively low R-squared values of all these simple models suggest that GDP and RDI growth only loosely fit national popular vote data. As such, continuing to add different variables — beyond the economy — to my model can help to increase its predictive performance. The predictive power of the economy can vary over time due to factors such as unexpected economic shocks (e.g. COVID-19), other policy concerns, and/or increasing political polarization.