Introduction
In this first blog post, I visualize and analyze historical popular vote data from 1948-2020 to examine the competitiveness of U.S. presidential elections and help inform predictions for the 2024 election. This blog also includes state-level analysis of past two-party popular vote share and looks at changes in battleground states over time.
Overall Two-Party Vote Share
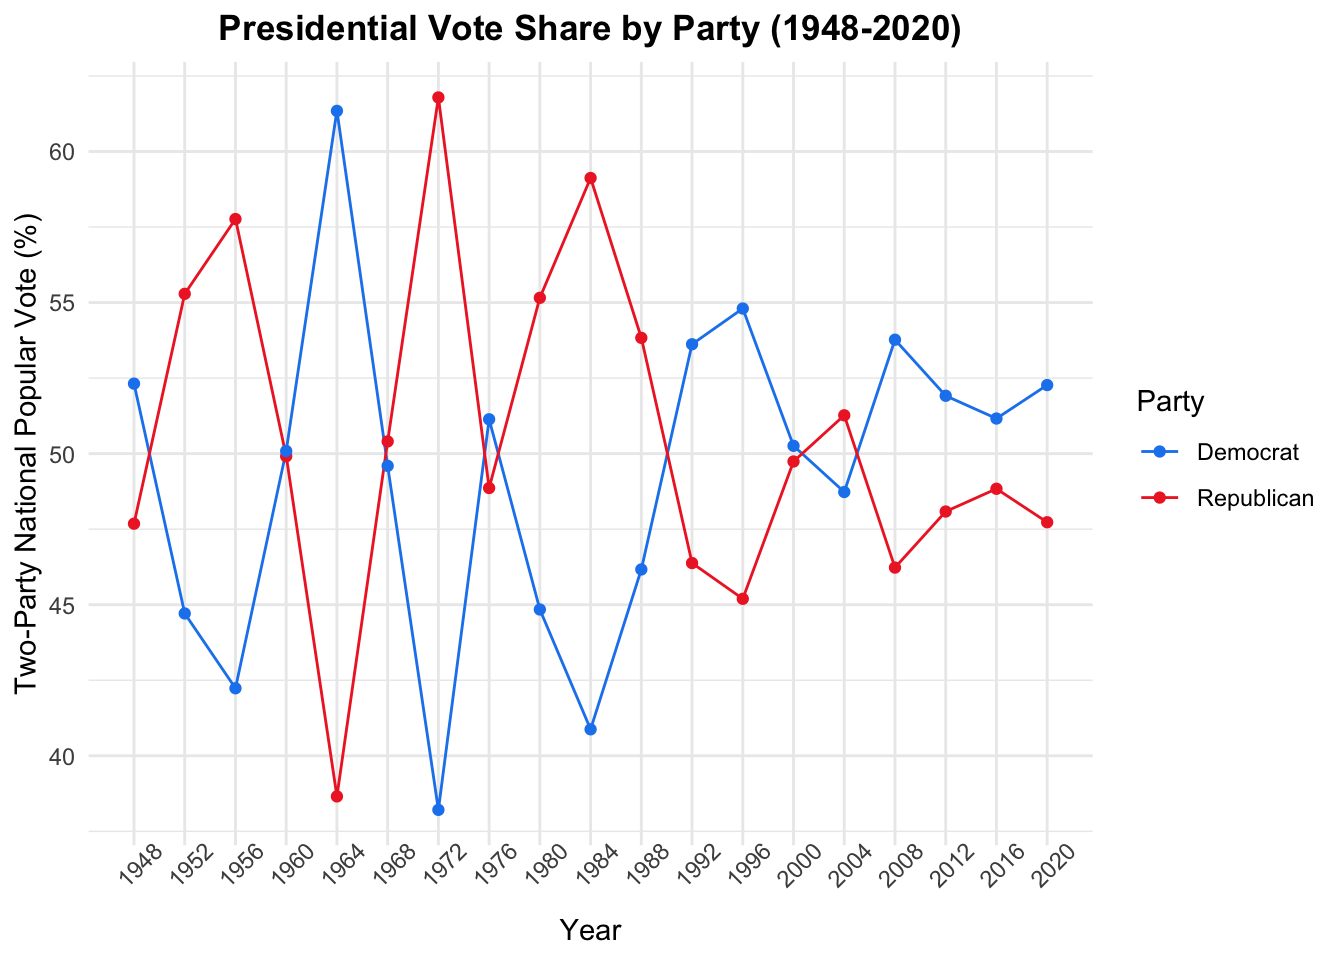
To begin, I will examine how two-party vote share in U.S. presidential elections have changed over time. The following plot displays the party distribution in the two-party national popular vote for each presidential election from 1948-2020.
More concisely, this second plot presents the difference in two-party national popular vote between the parties – referred to as the win margin – over time. It is calculated by subtracting the greater percentage of the two-party vote share (the winner) by the smaller percentage (the loser) for each election.
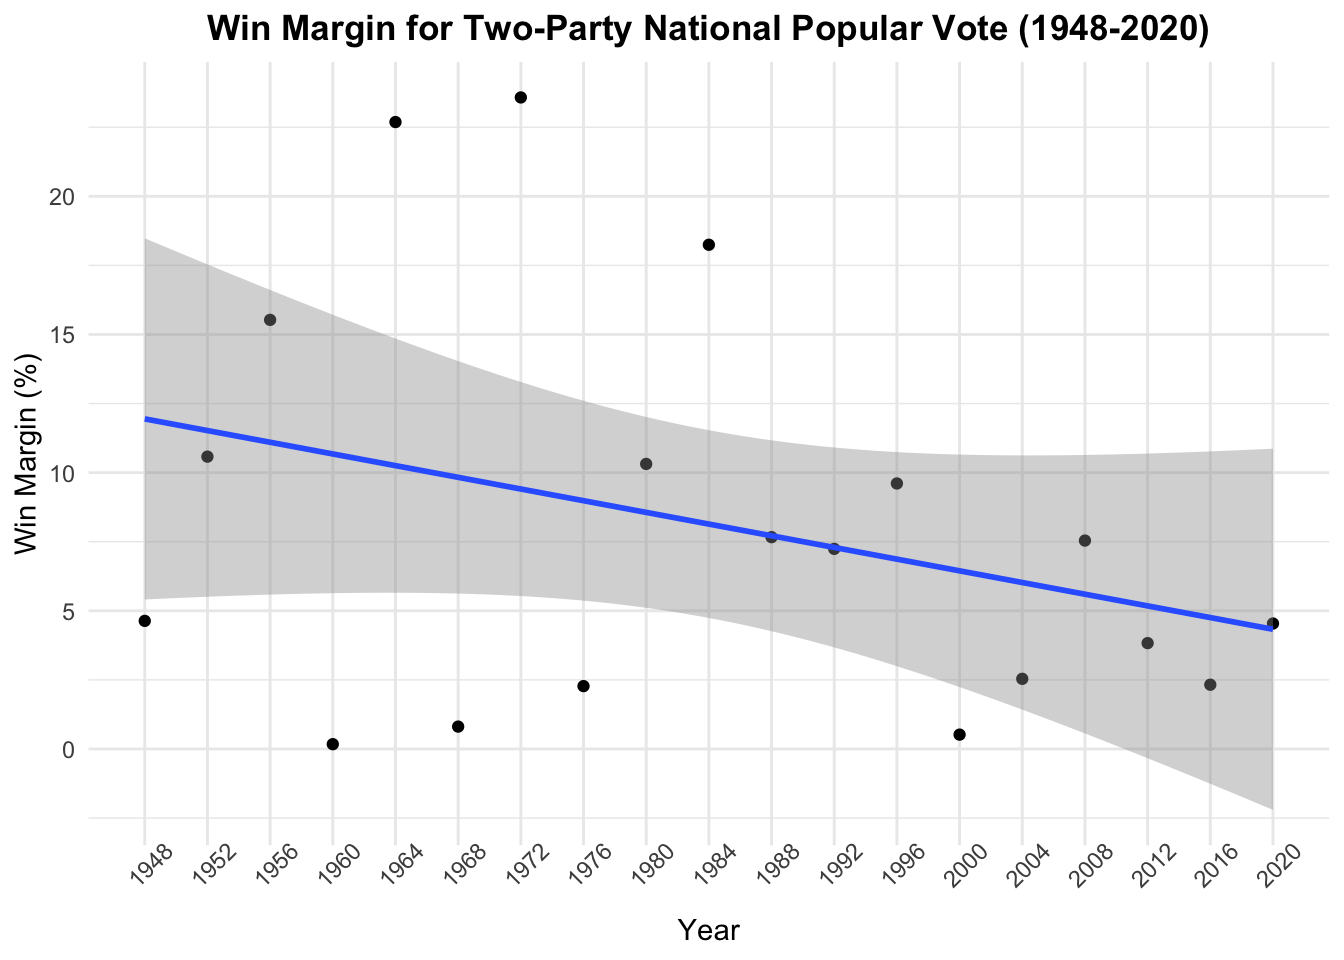
Notably, the win margin appears to decrease over time: the negative slope of the best fit line suggests that presidential elections have generally become more competitive in term of the two-party vote share. The 5 presidential elections with the smallest win margins are 1960, 1968, 1976, 2000 and 2016. Looking more closely at the four previous presidential elections, the win margin for two-party vote share appears to steadily decrease from 7.5% in 2008 to 3.8% in 2012 and 2.3% in 2016. In 2020, the win margin was 4.5%, slightly higher than 2016.
However, the R-squared value of approximately 0.1 for this line of best fit suggests that the linear relationship between the win margin and year is weak and this model is not a strong fit for the data. As such, while there is a negative trend, we should not predict future win margins for two-party vote share based solely on numbers from past presidential elections.
Two-Party Vote Share by State
Next, I analyze historical trends in two-party vote share on the state level. This visualization displays the win margin for the two-party vote share by state. Positive win margins indicate a two-party vote share that favors the Democratic candidate, while negative win margins represent a two-party vote share that favors the Republican candidate. The intensity of the color – blue for the Democrat and red for the Republican – represents the magnitude of the margin of victory.
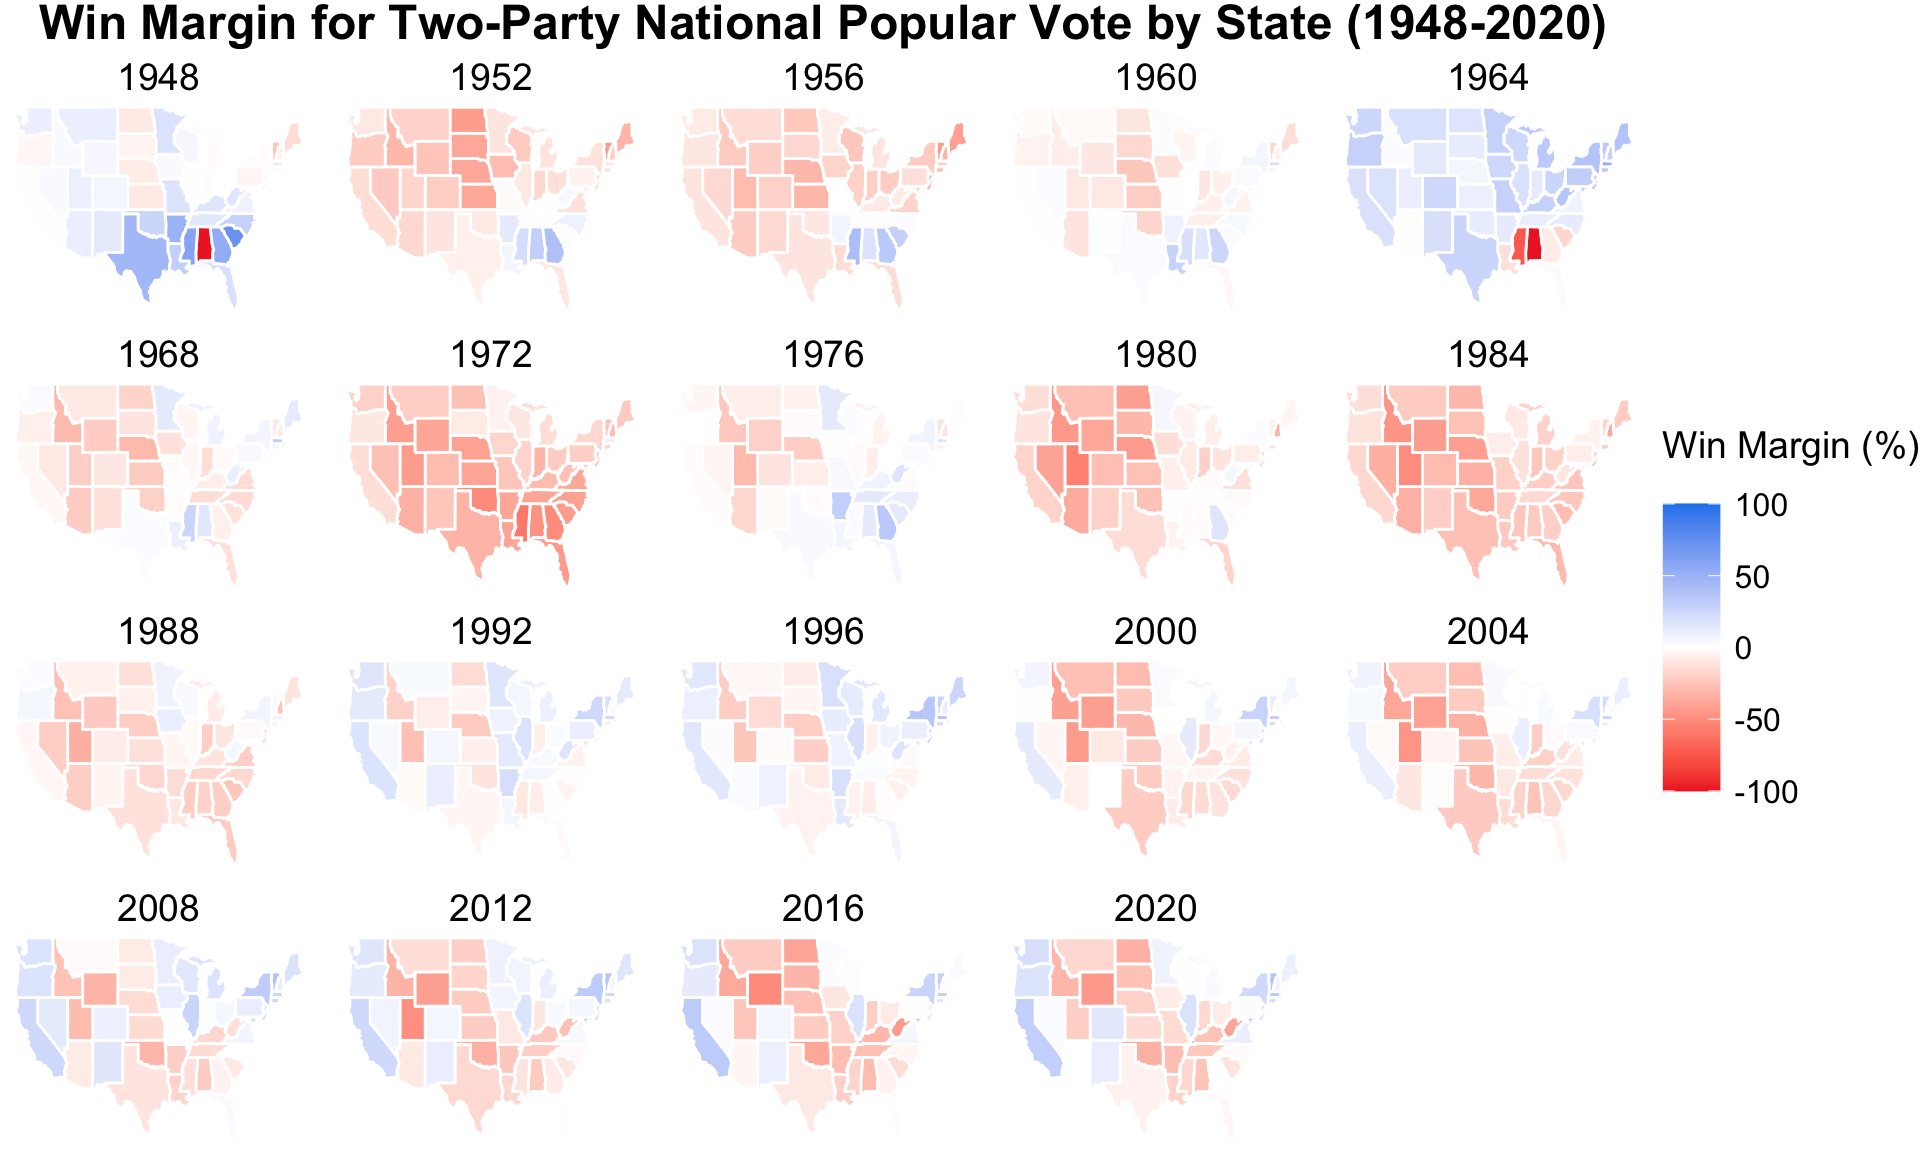
From the 1990s onward, states in the Great Plains and Deep South tend to vote for Republicans, while states in the Northeast, Mid-Atlantic region, and West Coast lean Democratic. This visualization reinforces the idea that presidential elections have become increasing competitive: Since the Reagan presidency, it appears that Democratic candidates have gained ground on their Republican counterparts in the two-party vote share, especially in the Rust Belt states. This data visualization also shows battleground states like Arizona, which are colored lighter and/or in white from year to year to indicate low win margins.
Swing Variation in Two-Party Vote Share
Diving deeper into battleground states, the following visualization exhibits “swing” in two-party vote share from by state from 1980-2020. The swing margin is determined by subtracting the two-party vote share for the Democratic candidate in a certain election from the Democratic two-party vote share of four years prior. Positive margins indicate a swing towards the Democratic candidate relative to the previous election, while negative margins indicate a swing towards the Republican candidate. Once again, the intensity of the color – blue for the Democrat and red for the Republican – represents the magnitude of the swing in two-party vote share. States that are lighter in color or white exhibit little swing between elections.
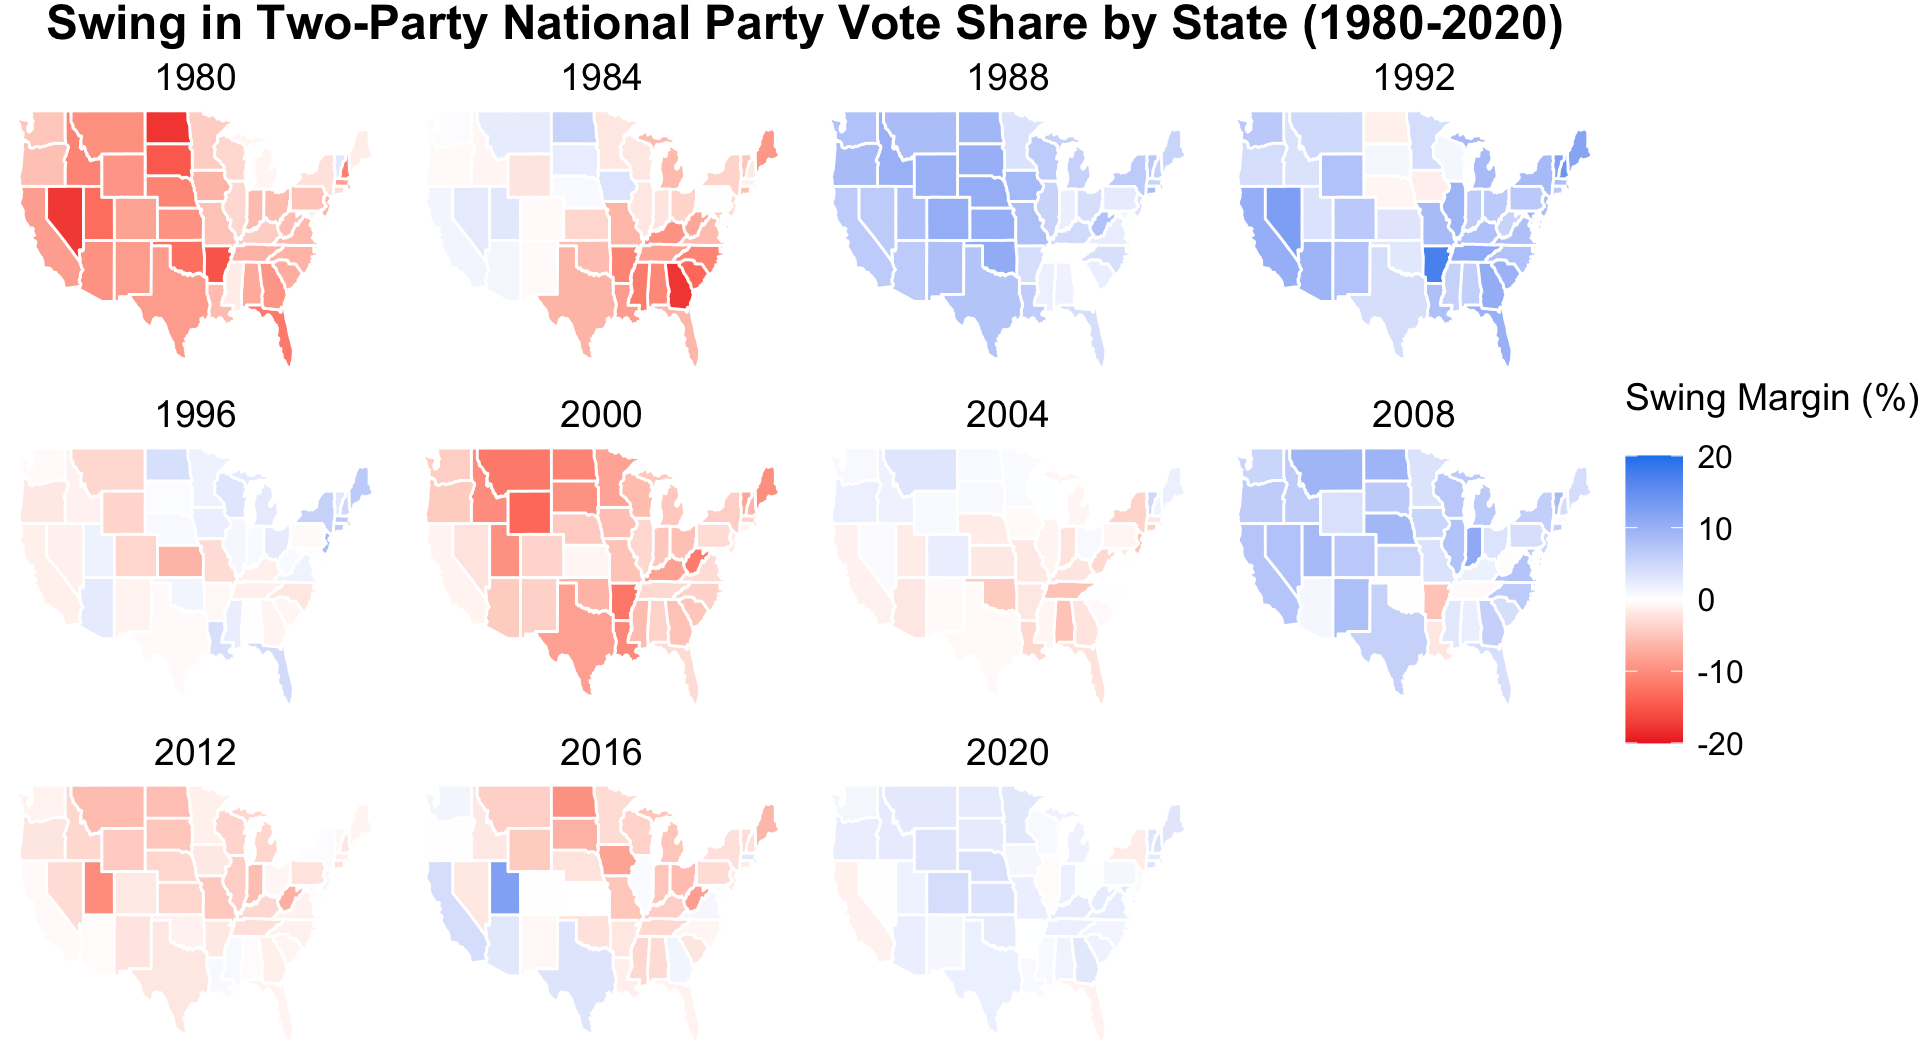
Although colored similarly to the previous visualization, it is important to note the difference in magnitude of the swing margin, which ranges from 20 to -20 here. Based on this visualization, states with consistent swings between red and blue include Pennsylvania, Wisconsin, Michigan, and North Carolina. In contrast, several states can be no longer considered battlegrounds. For example, California and New York have swung Democratic since the late 1980s.
Since Electoral College votes are allocated to candidates by state, state-level analysis is especially important for predictive models. For the last visualization, I calculated the predicted swing margins for the 2024 presidential election. First, I utilized the simplified Electoral Cycle Model of Y_2024 = 0.75(Y_2020) + 0.25(Y_2016) from our laboratory session to calculate the estimated Democratic and Republican two-party vote shares for 2024. I then subtracted the 2024 Democratic two-party vote share from its 2020 counterpart to determine the swing margin for 2024. Similar to the previous visualization, positive margins indicate a swing towards the Democratic candidate relative to 2020, while negative margins indicate a swing towards the Republican candidate.
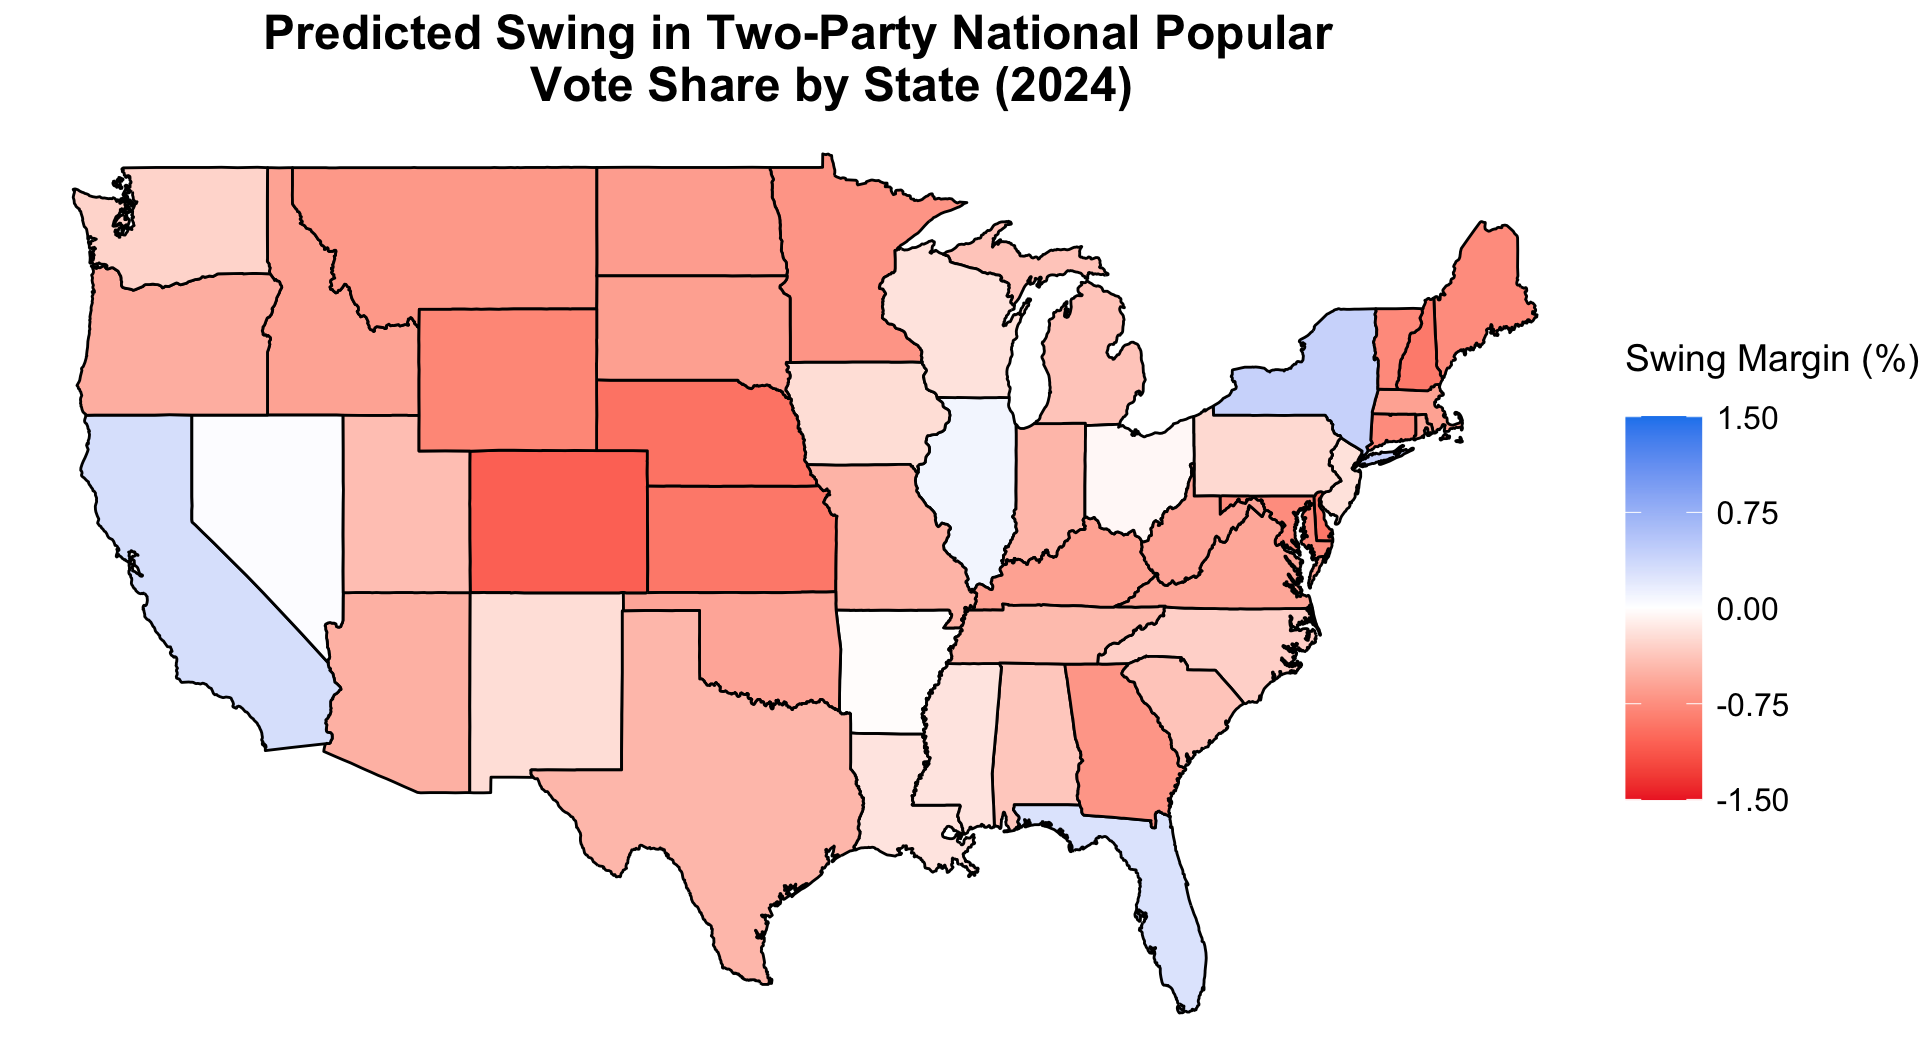
Based on this data visualization, the model predicts that a plurality of states will swing towards the Republican candidate this November (relative to 2020), including important battleground states such as Arizona, Georgia, and Pennsylvania. However, it is important to note that the swing margins presented by this model are quite small in magnitude – less than 2% in favor of either party. As mentioned earlier, it is therefore unlikely that we can predict future two-party vote share based on historical trends in vote share data alone. I look forward to exploring other factors that influence election outcomes – such as the economy and campaign activities – in the coming weeks.